- 562
Integrate SQL Agent with OpenAI and Quickchart.io for Data Visualization
Enhance reporting accuracy by integrating OpenAI and Quickchart.io into your SQL agent, enabling dynamic data visualization and improved analytics.
Enhance reporting accuracy by integrating OpenAI and Quickchart.io into your SQL agent, enabling dynamic data visualization and improved analytics.
Who is this workflow for? This workflow integrates OpenAI and Quickchart.io with a native SQL Agent to deliver dynamic data visualizations. It empowers teams to analyze and visualize data seamlessly within their existing SQL environment..
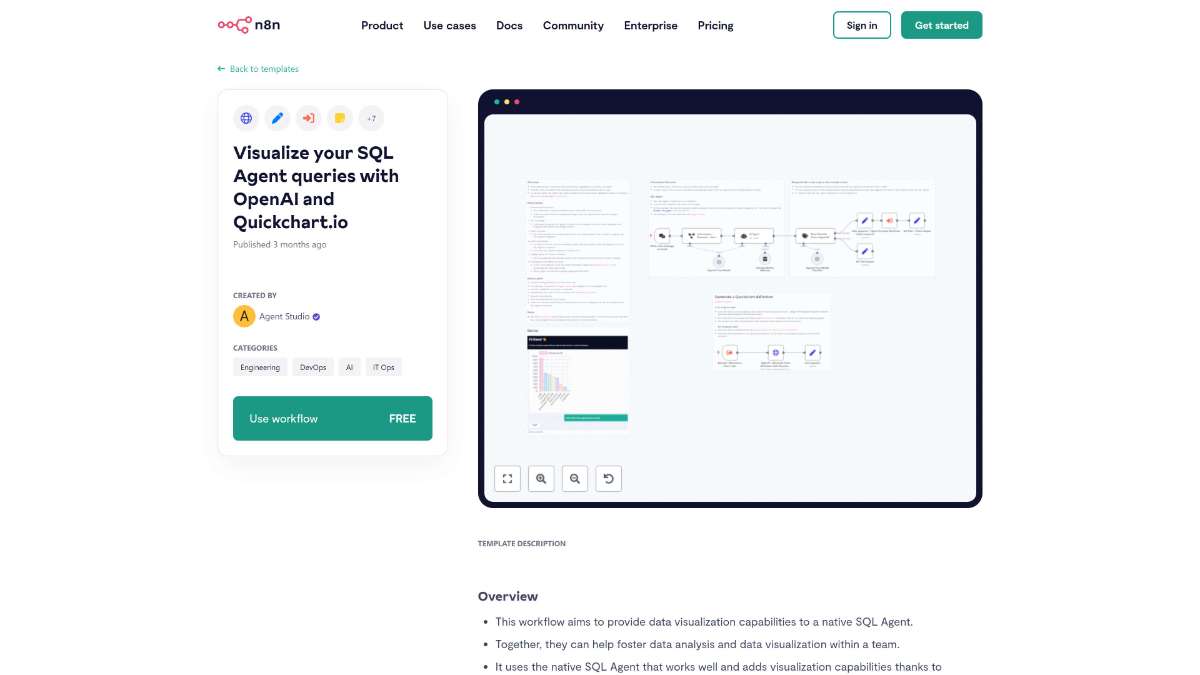
This workflow is ideal for data analysts, database administrators, and team members who rely on SQL Agents for data queries and seek to incorporate visual data representations without extensive manual setup.
This workflow seamlessly integrates OpenAI and Quickchart.io with your SQL Agent to provide automated data visualizations. By enhancing SQL query responses with dynamic charts, it facilitates more effective data analysis and decision-making within your team.
Streamline project management by linking Linear and Productboard features with n8n. Enhance workflow efficiency and maintain seamless updates.
Improve image processing with Gemini 2.0 in n8n. Utilize advanced features for accurate analysis and seamless integration.
Discover AI grant opportunities, streamline data collection, and assess eligibility efficiently with this n8n workflow template.
Help us find the best n8n templates
A curated directory of the best n8n templates for workflow automations.