- 692
Automate Comprehensive Google Analytics Reports with n8n
Streamline reporting by automating Google Analytics data. Benefit from real-time updates, easy integration, and customizable workflows with n8n.
Streamline reporting by automating Google Analytics data. Benefit from real-time updates, easy integration, and customizable workflows with n8n.
Who is this workflow for? This n8n workflow automates the collection, processing, and formatting of Google Analytics data into a comprehensive HTML report. By segmenting the report into Engagement Stats, Search Results, and Country Views, it provides organized insights that can be easily shared via email or saved as a document. Robust error handling and logging ensure reliable operation and facilitate troubleshooting..
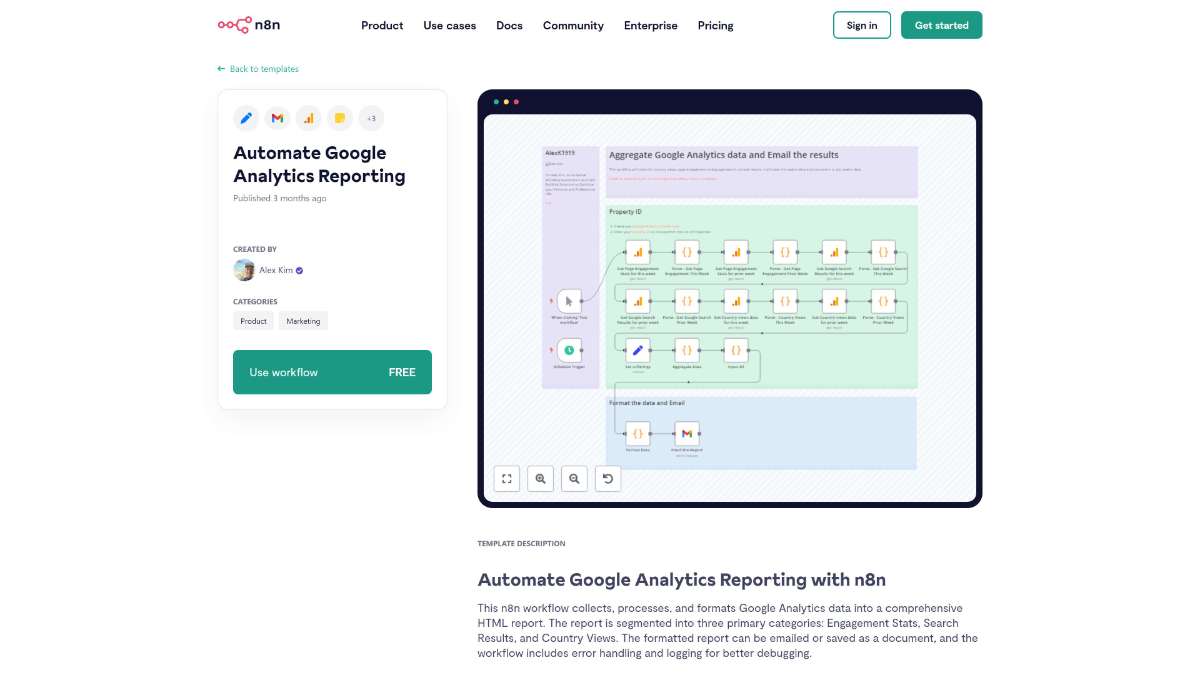
Parse - Get Page Engagement This Week and Parse - Country Views Prior Week, converting raw data into URL-safe strings for further processing.Aggregate Data node, the workflow combines parsed data into a single, structured JSON object, ensuring consistency and handling any missing or malformed data.Gmail node for sending the report to specified recipients.Google Docs node for storing the report as a document for future reference.This workflow is ideal for digital marketers, web analysts, and business intelligence professionals who rely on Google Analytics data to monitor website performance, track user engagement, and inform strategic decisions. It is also beneficial for teams seeking to automate routine reporting tasks to focus on data-driven insights.
This n8n workflow streamlines the process of generating Google Analytics reports by automating data collection, processing, and formatting. By delivering structured and visually appealing reports through email or document storage, it enhances the ability to derive actionable insights and supports informed decision-making.
Optimize Airtable tasks, boost efficiency, and process batch requests swiftly with key n8n features. Streamline operations with enhanced speed and accuracy.
Streamline support with automated Freshdesk tickets. Effortlessly manage issues and improve response times using this n8n template.
Design an efficient API endpoint using n8n to streamline workflows, automate processes, and integrate seamlessly with other services.
Help us find the best n8n templates
A curated directory of the best n8n templates for workflow automations.