- 726
AI-Powered System for Generating Charts
Explore streamlined data analysis with AI-driven chart creation and visualization, enhancing insights and decision-making in your workflow.
Explore streamlined data analysis with AI-driven chart creation and visualization, enhancing insights and decision-making in your workflow.
Who is this workflow for? Enhance your AI interactions by integrating dynamic chart generation using OpenAI’s Structured Output and Quickchart.io with this n8n workflow template..
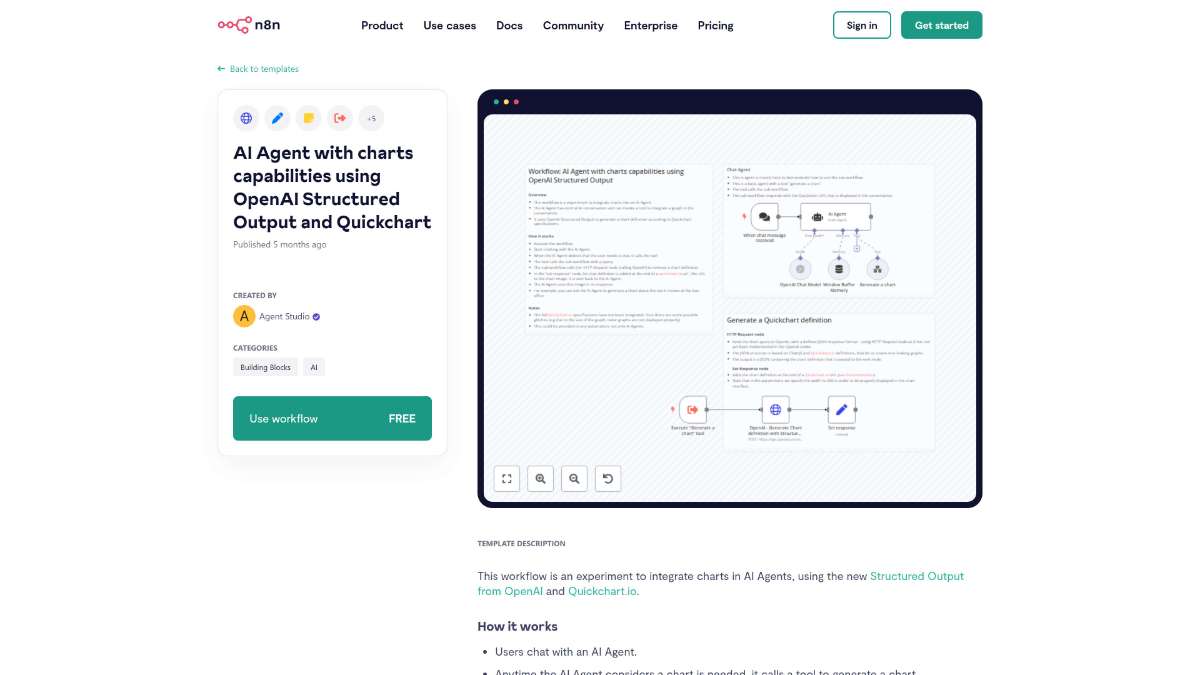
This workflow is designed for developers, data analysts, and businesses seeking to enrich AI-driven applications with automated charting functionality, enabling more informative and engaging user interactions.
This n8n workflow seamlessly integrates automated chart generation into AI-driven conversations, utilizing OpenAI’s Structured Output and Quickchart.io to deliver clear and customized visual data insights effortlessly.
Streamline task management by automating Onfleet task creation from new Airtable rows, saving time and reducing manual effort.
Discover enhanced decision-making by utilizing AI to analyze meetings. Automate note-taking and gain actionable insights effortlessly.
Streamline processes by managing n8n workflows via Telegram. Utilize command integration and automation for seamless operations.
Help us find the best n8n templates
A curated directory of the best n8n templates for workflow automations.